Reference Values
Reference Values View
The management screen provides a centralized list of all stored benchmarks.
-
Search and Discovery: A real-time Search bar allows administrators to quickly locate values by searching for specific indicators.
-
Download Import Template: Provides a standardized template to ensure external data is formatted correctly for the system.
-
Import: Allows for bulk-uploading large sets of reference data via external files.
-
Delete All: A protected action to clear all existing reference values from the system.
-
Summary Statistics: A status badge displays the total count of reference values currently configured across all indicators.
Reference values are typically sourced from previously published national data or international organizations such as UNSC, UNFPA, or the ILO. When configured, these values act as:
-
Visual Benchmarks: Appearing as contrast lines or targets in bar and line charts.
-
Performance Gauges: Providing the "goal" values for gauge artifacts to visually indicate achievement levels through color-coded scales.
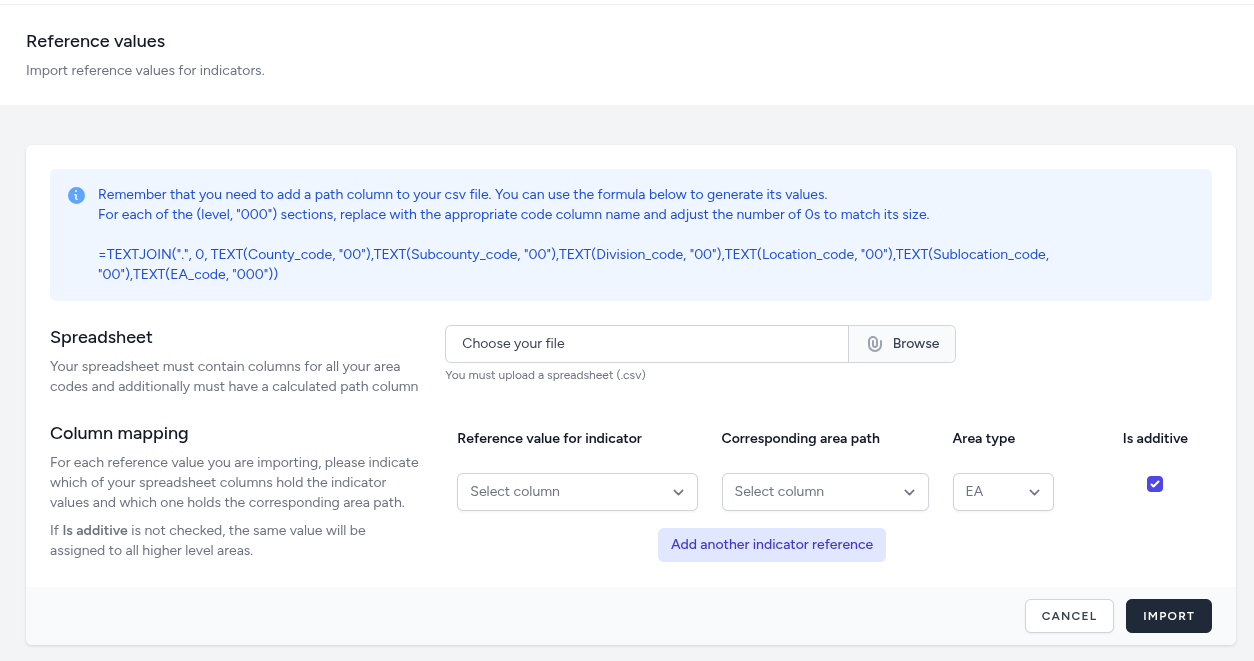
Importing
he Reference Value Import interface provides a robust mechanism for bulk-loading external benchmarks into the dashboard via CSV spreadsheets. This process ensures that comparative data is precisely mapped to the correct geographic entities and indicators.
Data Preparation Requirements
Before uploading, the spreadsheet must be formatted with specific columns to ensure compatibility with the system's hierarchical structure:
-
Area Codes and Path: The file must contain columns for all area codes.
-
Calculated Path Column: A mandatory "path" column is required to uniquely identify geographic units. The interface provides a functional Excel-style formula to help users generate these values by joining codes with a dot separator (e.g., County_code.Subcounty_code.EA_code). This is displayed on top of the form so it can be copied and pasted into your excel file.
Column Mapping and Configuration
Once a file is selected, administrators must map their spreadsheet columns to the application’s internal fields:
-
Reference value for indicator: Select the column containing the numeric benchmark values.
-
Corresponding area path: Map the column containing the pre-calculated geographic path strings.
-
Area type: Define the hierarchical level (e.g., EA, Sublocation) these specific values apply to.
-
Is additive:
-
Checked (Additive): Use this for benchmarks that represent totals or absolute numbers (e.g., "Total Population Target"). These values are treated as summable components within the hierarchy and will be added to the parent area's value.
-
Unchecked (Non-Additive): Use this for rates, ratios, or percentages (e.g., "Birth Rate" or "Literacy Rate"). If this is not checked, the system recognizes that the value is a rate and will assign that specific value to the selected area without attempting to sum it into higher-level parent values.
-
Multi-Indicator Imports
The interface supports the simultaneous import of multiple benchmarks. By clicking "Add another indicator reference," administrators can map additional columns from the same spreadsheet to different system indicators in a single operation.